Super-resolution data analysis of IC342
Developing a super-resolution data analysis in the case of IC 342
IC 342 is a gas-rich spiral galaxy with active star formation in its nucleus. IC 342 is located behind the Galactic plane und is there-fore highly obscured; the distance to the nearly face-on galaxy is still debated. Tikhonov & Galazutdinova(2010) give a distance of 3.9±0.1 Mpc derived from stellar photometry. Within its central 30′′two molecular arms of a mini-spiralend in a clumpy central ring of dense gas, which surrounds a young star cluster. Downes et al.(1992) showed the presence of five giant molecular clouds, A to E, around the nucleus of IC 342 with masses of 1 mil. solar masses. The central molecular ring surrounds a nuclear star cluster with active star formation and strong far-ultraviolett (FUV) radiation, illuminating the molecular ring and producing photo-dissociation regions (PDRs) on the side facing the central cluster. Energetic FUV photons dissociate and ionize molecules and atoms in the gas and effectively heat the gas and dust via photoelectric heating. Consequently, PDRs strongly emit radiation from species that are abundant and excited under these conditions, like [CII].
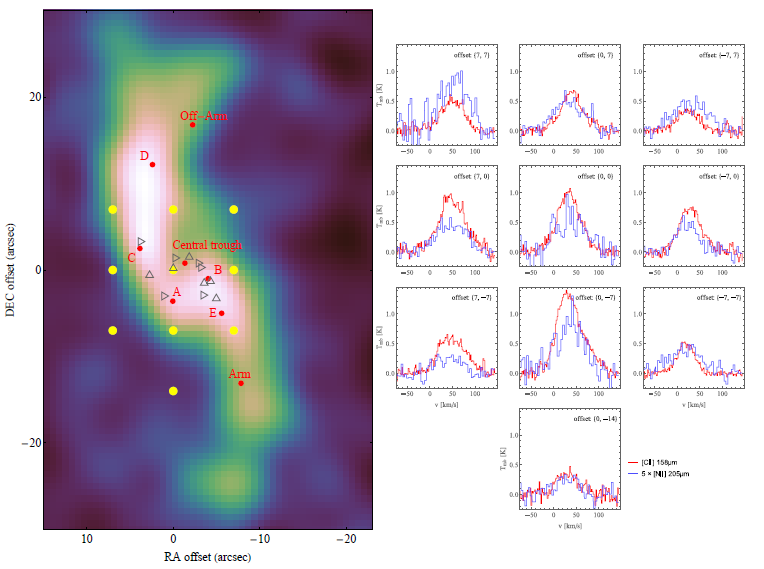
Figure: Line-integrated map of the 12CO(1-0) transition from the BIMA-SONG sample. The yellow points show the observed GREAT positions in IC 342. The (0, 0) position corresponds to (RA, Dec) (J2000) (03:46:48.5 68:05:47). The red points indicate named GMCs and other structures according to Table 3 in Meier & Turner (2001). Triangles facing up and right indicate HII regions and super nova remnants, respectively, as given by Tsai et al. (2006). The [CII] and [N II] spectra are shown on the right side. The [NII] intensity scale is multiplied by a factor of 5.
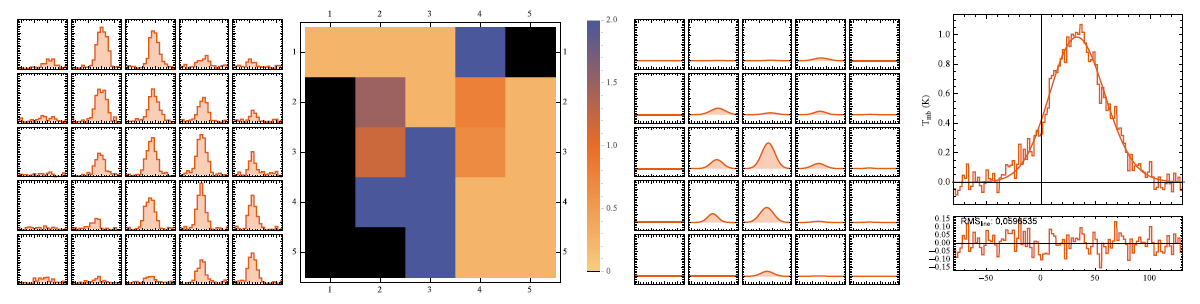
We developed novel technique to derive additional conclusions based on the kinematic information at hand. In addition to the high spectral resolution of the SOFIA data, we also have a data set with high angular resolution, the 12CO (1-0) data with a resolution of 5.5’’. If there is a correlation between C+ and CO, then this correlation should also be visible in the kinematic signature of the [C II] lines. The spectral line profile of [C II] emitted at a certain position should therefore be the result of the Gaussian smoothing of the unresolved structures within the beam. We make use of the CO data with significantly higher spatial resolution to derive a super-resolution map of the ionized C+ gas.