
Kinematics of the interstellar medium
S 106
The massive star forming region S106 shows a bipolar outflow with a complex velocity structure in its emission. S106 is embedded in a large molecular cloud and is partly obscured by a dark dusty foreground lane possibly an extension of the small-scale disk around S106-IR.
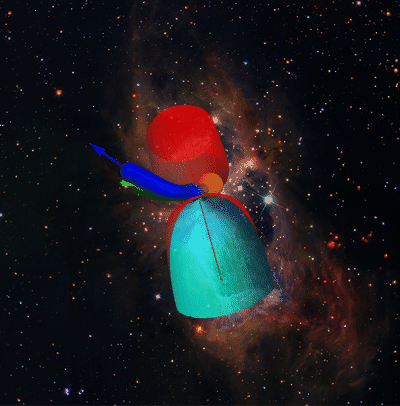 Figure: Schematic view of the S106 region as seen on the sky. The nebula is tilted ~25° to the east in the plane of the sky; the northern lobe, which is more obscured by foreground gas and dust, is inclined (~15°) away from the observer. The southern lobe is inclined towards the observer and lacks the front side. The bipolar nebula and the HII region are embedded in an extended molecular cloud. The background is a Hubble/Subaru composite image. As S106 is seen on the sky, does not allow us to distinguish between infall scenario (dark lane in green) or expansion scenario (dark lane in blue) of the gas in the dark lane. The middle view shows best the ‘accretion flow’ scenario, i.e. how the (green) dark lane wraps around the equatorial waist of the hourglass-nebula. The right view shows how the (blue) dark lane, which is more detached from the nebula, is tilted towards the observer and dispersed.
S106 IR and its bipolar HII region are embedded in a larger molecular cloud that provides the gas reservoir for a possible accretion flow onto S106 IR. Mapping of the high-density tracer H13CO+ 1-0 revealed a velocity gradient across the dark lane that is consistent with either a flow onto S106 IR or gas streaming away, depending on the geometry of the region. Only interferometric observations (NOEMA proposal accepted) can elucidate the nature of the dark lane. The flow scenario is more consistent with the fragmentation induced starvation scenario of Peters et al. (2010a,b) than with the monolithic collapse model of McKee & Tan (2002). As yet unclear is whether shocks driven by the ionizing stellar wind that hits the accretion flow and the cavity walls can also cause the observed emission of the FIR lines. It is also not clear to what extent the [O I] 63 µm line is self-absorbed. Higher line intensities will change the [CII]/[OI] line ratios and thus modify the outcome of the PDR models. Observations of the [OI] 145 µm line, if this line is optically thin, may help to tackle this problem.
Summarizing, this study shows that the new detection of high-velocity emission in the [OI] line, and the identification of various velocity components in other FIR lines ([CII], high-J CO), which are only now possible with the (up)GREAT receiver on SOFIA, help to diagnose more precisely the physical properties of different gas phases in complex star-forming regions.
The atypical rotation of the galaxy IC 342
IC 342 is a gas-rich spiral galaxy with active star formation in its nucleus. IC 342 is located behind the Galactic plane und is there-fore highly obscured; the distance to the nearly face-on galaxy is still debated. Tikhonov & Galazutdinova(2010) give a distance of 3.9±0.1 Mpc derived from stellar photometry. Within its central 30′′two molecular arms of a mini-spiralend in a clumpy central ring of dense gas, which surrounds a young star cluster. Downes et al.(1992) showed the presence of five giant molecular clouds, A to E, around the nucleus of IC 342 with masses of 1 mil. solar masses. The central molecular ring surrounds a nuclear star cluster with active star formation and strong far-ultraviolett (FUV) radiation, illuminating the molecular ring and producing photo-dissociation regions (PDRs) on the side facing the central cluster. Energetic FUV photons dissociate and ionize molecules and atoms in the gas and effectively heat the gas and dust via photoelectric heating. Consequently, PDRs strongly emit radiation from species that are abundant and excited under these conditions, like [CII].
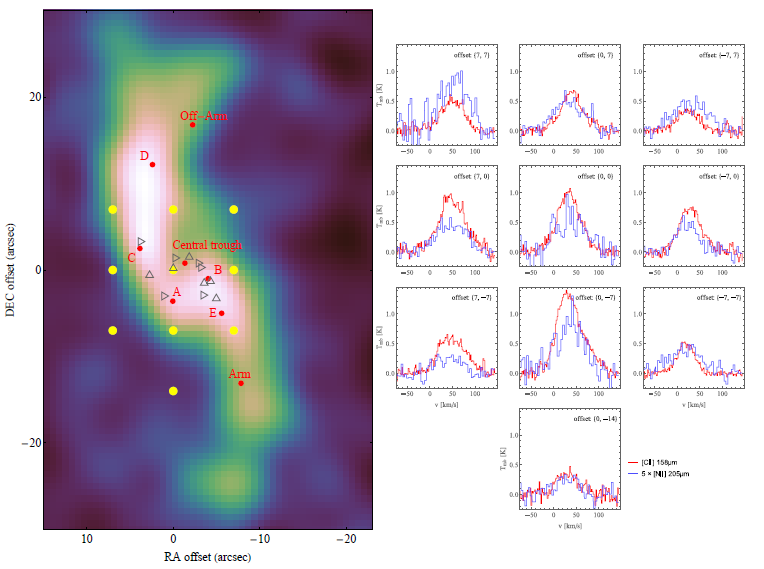
Figure: Line-integrated map of the 12CO(1-0) transition from the BIMA-SONG sample. The yellow points show the observed GREAT positions in IC 342. The (0, 0) position corresponds to (RA, Dec) (J2000) (03:46:48.5 68:05:47). The red points indicate named GMCs and other structures according to Table 3 in Meier & Turner (2001). Triangles facing up and right indicate HII regions and super nova remnants, respectively, as given by Tsai et al. (2006). The [CII] and [N II] spectra are shown on the right side. The [NII] intensity scale is multiplied by a factor of 5.
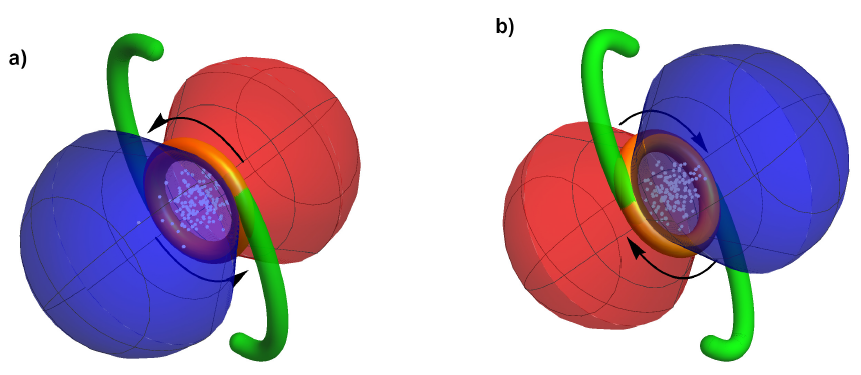
Figure: Geometrical and kinematic scenarios as explained suggested by Meier & Turner 2005 (a), and slightly modified our work (b). The red and blue lobe structures indicate the bi-conic expanding HII gas mentioned in the text. Blue gas is moving toward the observer, red gas is moving away. The mini-spiral (green) and ring (yellow) are surrounding the central nuclear star cluster (white stars), which gives rise to the expanding HII regions as well as to the intense PDR emission from the gas in the ring/spiral facing the cluster. As a result of our studies, we propose new geometry with a leading spiral arm.